Research Question:
How does pH affect catalase's activity in breaking down hydrogen peroxide?
Why is it worthy of study?
H2O2 (Hydrogen Peroxide) is a by-product that our cells create as part of normal cell processes, however hydrogen peroxide is toxic to our cells. Thankfully, there is an enzyme called catalase that breaks down hydrogen peroxide into water and oxygen. Catalase prevents hydrogen peroxide from building up and killing our cells. By investigating the pH at which there is high catalase activity, we can see that if our body were at a different pH, the catalase may not be able to work as well and thus we might be poisoned by hydrogen peroxide. We can also use this experiment to determine the optimum pH for catalase activity, so we can see if it matches our body’s pH, and if the optimum pH and our body’s pH are different, we can figure out how to speed up the catalase activity by changing the pH.
Hypothesis:
If the pH the catalase is subject to is acidic (low pH) then there will be more enzyme activity than if it were subject to a base, because the enzyme catalase is specific to breaking down hydrogen peroxide, and hydrogen peroxide is an acid, so catalase should work best in an acidic environment.
Variables:
The independent variable is the pH of the substance that the potato is submerged in along with hydrogen peroxide. We will manipulate the independent variable by subjecting the potato to three different pH substances, one low pH, one neutral pH, and one high pH.
The dependent variable is catalase activity. We will measure catalase activity by using a thermometer to measure the temperature of the catalase and hydrogen peroxide mixture after the independent variable substance has been added.
The Constants: Because having different amounts of catalase may result in more or less catalase activity and thus cause the temperatures of the trials to be inconsistent, a constant is the amount of catalase used. We will control the amount of catalase used in each trial by using a potato as our source of catalase and using a ruler to measure and cut the potato into 1cm by 1cm by 1cm cubes. By cutting the potato chunks sizes consistently, we can keep the amount of catalase for each trial constant. If there is more or less hydrogen peroxide it may affect how much the catalase will try to break it down, and this will affect the temperature as well. Thus, another constant is the amount of hydrogen peroxide. We will control the amount of hydrogen peroxide by using a graduated cylinder to measure out 10mL of hydrogen peroxide per trial, so by controlling the volume of the hydrogen peroxide used, we are also keeping the amounts of hydrogen peroxide used the same.
We will control the amounts of the different pH substances by using a graduated cylinder to measure out 10mL of each substance per trial. By keeping the volumes of the substances consistent throughout each trial, we are making sure that the amounts of substances does not affect the outcome, which is supposed to be determined by the pH of the substances, not the amounts of the substances.
We will also keep consistent the type of potato, so that we are observing pH’s effect on catalase activity rather than the different types of potatoes’ effect on catalase activity.
We will do this by cutting all of our potato cubes for the trials from one raw potato.
We will also keep the type of pH substances used for each trial the same. We will do this by only using tap water for the water trials, only using vinegar from the same bottle for each vinegar trial, only using ammonia form the same bottle for each ammonia trial, and only using hydrogen peroxide from the same bottle throughout all of the trials.
We will also keep he amount of stirring the mixtures will be given, so we will keep the amount of stirring to a minimum and not vigorously blend the catalase, pH substance, and hydrogen peroxide together. We will instead not do any stirring and simply pour the substances in.
Trials:
According to the 5x5 rule, there should be about 25 total trials. Since we have three variations of the independent variable we are testing for, we will do 8 trials per variation, which adds up to 24 total trials. Having eight trials per variation should ensure that we get consistent results and that we are able to see the general trend of each variation.
What about data?
We will collect the data by using a thermometer to measure the initial temperature of the catalase in the pH substance, and then the highest temperature reached after the addition of hydrogen peroxide to the catalase and pH substance.
How to process the data?
A higher temperature should indicate more catalase activity. We will process the data by finding the difference between the initial temperature of the catalase and pH substance without adding hydrogen peroxide, and the highest temperature that occurred after adding hydrogen peroxide. If the highest temperature reached increases several degrees from the initial temperature, then the pH of the substance used for the trial increases catalase activity. If the initial temperature was slightly higher than or equal to the temperatures that occurred after adding hydrogen peroxide, then that shows that the pH used for that trial does not affect catalase activity.
How do we select appropriate materials and equipment using a logical, complete, and safe method?
To test for different pH’s effects, we will need one acid, one base, and one neutral pH, so we can cover each major portion of the pH scale. Thus we have chosen ammonia as a base, vinegar as an acid, and water as neutral pH. We will use all raw potatoes instead of baked and frozen because we are testing for pH, not temperature. We will use 1 cm by 1 cm by 1 cm potato cubes so this way we can cut out uniform amounts of catalase and we will use a knife and ruler to do this because this way we will be able to cut the potato more efficiently and accurately compared to the sloppiness of scissors or the time-consuming effort of small scalpels. We will use 10 mL of the pH substance and 10 mL of hydrogen peroxide because 20 mL of liquid is enough to submerge the potato cube completely in the mixture. We will use graduated cylinders, rather than beakers, to measure because the graduated cylinders will be able to tell us ore accurately where the 10 mL mark is. We will need goggles, because this experiment includes glassware and liquids. We will use plastic rulers because then we will be able to wash off the potato from the ruler.
Materials:
2 graduated cylinders
24 plastic or paper cups
200 mL of vinegar
200 mL of ammonia
200 mL of water
600 mL of H2O2 (Hydrogen Peroxide)
1 knife to cut potatoes
1 ruler (cm)
8 thermometers (Celsius)
Sharpies
Paper Towel
Safety Goggles (one pair per person doing the experiment)
Paper and Pencil (to record data)
Procedure
Safety rules
Please keep goggles on throughout the duration of the experiment, as there is glassware and liquids. Be careful when handling and cleaning the glassware and graduated cylinders. Please be careful with transporting the equipment from the experiment area to the sink. Please do not directly smell any of the substances, particularly ammonia, (that is not pleasant experience.) Rather, if you must know what a substance smells like, you can gently waft the scent towards your nose. After using the knife please place it in an area where it will not interfere with the rest of the experiment or cause any harm, or clean it and return it to its storage area. No horseplay or fooling around with the substances or the knives, because the substances could get into your eyes, and then you will need to use the emergency eye wash kit, and the knife may puncture someone’s skin and cause infection, not to mention bleeding and wounds. Please refrain from drinking the substances. Despite being water and vinegar, this is an experimental setting and thus none of the materials shall enter your mouth. You are not required to wear gloves, however please take caution with the knives when cutting potatoes.
1. Cut one raw potato into 24 cubes, each measuring 1 cm cubed, using a knife.
2. Put one potato cube into each of the plastic cups (one potato per cup; total 24 cups)
3. Use a Sharpie to label 8 cups “Water,” 8 different cups “Vinegar,” and the last 8 cups “Ammonia”
4. Create a data table with 7 columns and 9 rows. Label the second column “Water Initial,” the third column “Water Final,” the fourth “Vinegar Initial,” the fifth “Vinegar Final,” the sixth “Ammonia Initial” and the seventh “Ammonia Final.” Label the rows “Cup 1” “Cup 2”, etc. A copy of the data table format can be found in the Materials section.
5. Use a graduated cylinder to measure and add 10 ml of water to each of the 8 “Water” cups, (each cup should have 10 mL of water)
6. Put one thermometer into each “Water” cup and measure the initial Celsius temperature of each (you may need to wait for the thermometer to stabilize to the temperature of the liquid within the cup.)
7. Record the initial temperature (all temperatures measured and recorded should be in Celsius) of each in the data table’s “Water Initial” column, making sure to keep track of which cup is which. Make sure that the thermometers are still in the cups.
8. Measure 10 mL of hydrogen peroxide in a graduated cylinder. Pour the 10 mL of hydrogen peroxide to one of the 8 “Water” cups. Measure another 10 mL of hydrogen peroxide in the graduated cylinder and pour it into a different “Water” cup. Repeat this until all of the “Water” cups have 10 mL of hydrogen peroxide.
9. After pouring 10 mL hydrogen peroxide into each of the cups, observe the temperatures of each cup’s solution using the thermometer already in the cup.
10. Record the highest temperature shown by the thermometer after adding hydrogen peroxide to the solution in the data table, in the “Water Final” column.
11. Dispose of the solution in the cups, and throw away the used cups and potato cubes. Wash and dry your thermometers and graduated cylinders thoroughly. Wait 2-3 minutes for your thermometers to stabilize to room temperature.
12. Take the 8 “Vinegar” cups and use a graduated cylinder to measure out 10mL of vinegar per cup. Pour 10mL of vinegar into each “Vinegar” cup.
13. Place one thermometer into each “Vinegar” cup and record the initial temperature of each cup in the data table’s “Vinegar Initial” column. Keep the thermometers in the cups.
14. Measure 10 mL of hydrogen peroxide in a graduated cylinder. Pour the 10 mL of hydrogen peroxide to one of the 8 “Vinegar” cups. Repeat this until all of the “Vinegar” cups have 10 mL of hydrogen peroxide.
15. After pouring 10 mL hydrogen peroxide into each of the “Vinegar” cups, observe the temperatures of each “Vinegar” cup’s solution using the thermometer already in the cup.
16. Record the highest temperature shown by the thermometer after adding hydrogen peroxide to the solution in the data table, in the “Vinegar Final” column.
17. Dispose of the solution in the cups, and throw away the used cups and potato cubes. Wash and dry your thermometers and graduated cylinders thoroughly. Wait 2-3 minutes for your thermometers to stabilize to room temperature.
18. Take the 8 “Ammonia” cups and use a graduated cylinder to measure out 10mL of ammonia per cup. Pour 10mL of ammonia into each “Ammonia” cup.
19. Place one thermometer into each “Ammonia” cup and record the initial temperature of each cup in the data table’s “Ammonia Initial” column. Keep the thermometers in the cups.
20. Measure 10 mL of hydrogen peroxide in a graduated cylinder. Pour the 10 mL of hydrogen peroxide to one of the 8 “Ammonia” cups. Repeat this until all of the “Ammonia” cups have 10 mL of hydrogen peroxide.
21. After pouring 10 mL hydrogen peroxide into each of the “Ammonia” cups, observe the temperatures of each “Ammonia” cup’s solution using the thermometer already in the cup.
22. Record the highest temperature shown by the thermometer after adding hydrogen peroxide to the solution in the data table, in the “Ammonia Final” column.
23. Dispose of the solution in the cups, and throw away the used cups and potato cubes. Wash and dry your thermometers and graduated cylinders thoroughly. Wait 2-3 minutes for your thermometers to stabilize to room temperature.
24. Clean up your experiment area, wipe away any spilled substances, throw away the paper towel, wash and dry the knife, rinse and dry the ruler, and place the safety goggles in their designated place.
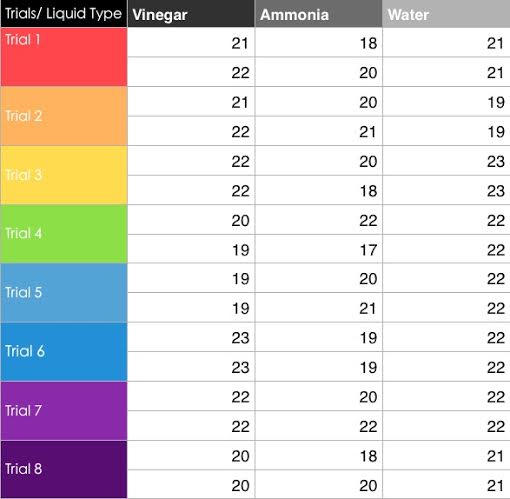
Change in temperature as a result of ammonia, vinegar, and water
How does pH affect catalase's activity in breaking down hydrogen peroxide?
Why is it worthy of study?
H2O2 (Hydrogen Peroxide) is a by-product that our cells create as part of normal cell processes, however hydrogen peroxide is toxic to our cells. Thankfully, there is an enzyme called catalase that breaks down hydrogen peroxide into water and oxygen. Catalase prevents hydrogen peroxide from building up and killing our cells. By investigating the pH at which there is high catalase activity, we can see that if our body were at a different pH, the catalase may not be able to work as well and thus we might be poisoned by hydrogen peroxide. We can also use this experiment to determine the optimum pH for catalase activity, so we can see if it matches our body’s pH, and if the optimum pH and our body’s pH are different, we can figure out how to speed up the catalase activity by changing the pH.
Hypothesis:
If the pH the catalase is subject to is acidic (low pH) then there will be more enzyme activity than if it were subject to a base, because the enzyme catalase is specific to breaking down hydrogen peroxide, and hydrogen peroxide is an acid, so catalase should work best in an acidic environment.
Variables:
The independent variable is the pH of the substance that the potato is submerged in along with hydrogen peroxide. We will manipulate the independent variable by subjecting the potato to three different pH substances, one low pH, one neutral pH, and one high pH.
The dependent variable is catalase activity. We will measure catalase activity by using a thermometer to measure the temperature of the catalase and hydrogen peroxide mixture after the independent variable substance has been added.
The Constants: Because having different amounts of catalase may result in more or less catalase activity and thus cause the temperatures of the trials to be inconsistent, a constant is the amount of catalase used. We will control the amount of catalase used in each trial by using a potato as our source of catalase and using a ruler to measure and cut the potato into 1cm by 1cm by 1cm cubes. By cutting the potato chunks sizes consistently, we can keep the amount of catalase for each trial constant. If there is more or less hydrogen peroxide it may affect how much the catalase will try to break it down, and this will affect the temperature as well. Thus, another constant is the amount of hydrogen peroxide. We will control the amount of hydrogen peroxide by using a graduated cylinder to measure out 10mL of hydrogen peroxide per trial, so by controlling the volume of the hydrogen peroxide used, we are also keeping the amounts of hydrogen peroxide used the same.
We will control the amounts of the different pH substances by using a graduated cylinder to measure out 10mL of each substance per trial. By keeping the volumes of the substances consistent throughout each trial, we are making sure that the amounts of substances does not affect the outcome, which is supposed to be determined by the pH of the substances, not the amounts of the substances.
We will also keep consistent the type of potato, so that we are observing pH’s effect on catalase activity rather than the different types of potatoes’ effect on catalase activity.
We will do this by cutting all of our potato cubes for the trials from one raw potato.
We will also keep the type of pH substances used for each trial the same. We will do this by only using tap water for the water trials, only using vinegar from the same bottle for each vinegar trial, only using ammonia form the same bottle for each ammonia trial, and only using hydrogen peroxide from the same bottle throughout all of the trials.
We will also keep he amount of stirring the mixtures will be given, so we will keep the amount of stirring to a minimum and not vigorously blend the catalase, pH substance, and hydrogen peroxide together. We will instead not do any stirring and simply pour the substances in.
Trials:
According to the 5x5 rule, there should be about 25 total trials. Since we have three variations of the independent variable we are testing for, we will do 8 trials per variation, which adds up to 24 total trials. Having eight trials per variation should ensure that we get consistent results and that we are able to see the general trend of each variation.
What about data?
We will collect the data by using a thermometer to measure the initial temperature of the catalase in the pH substance, and then the highest temperature reached after the addition of hydrogen peroxide to the catalase and pH substance.
How to process the data?
A higher temperature should indicate more catalase activity. We will process the data by finding the difference between the initial temperature of the catalase and pH substance without adding hydrogen peroxide, and the highest temperature that occurred after adding hydrogen peroxide. If the highest temperature reached increases several degrees from the initial temperature, then the pH of the substance used for the trial increases catalase activity. If the initial temperature was slightly higher than or equal to the temperatures that occurred after adding hydrogen peroxide, then that shows that the pH used for that trial does not affect catalase activity.
How do we select appropriate materials and equipment using a logical, complete, and safe method?
To test for different pH’s effects, we will need one acid, one base, and one neutral pH, so we can cover each major portion of the pH scale. Thus we have chosen ammonia as a base, vinegar as an acid, and water as neutral pH. We will use all raw potatoes instead of baked and frozen because we are testing for pH, not temperature. We will use 1 cm by 1 cm by 1 cm potato cubes so this way we can cut out uniform amounts of catalase and we will use a knife and ruler to do this because this way we will be able to cut the potato more efficiently and accurately compared to the sloppiness of scissors or the time-consuming effort of small scalpels. We will use 10 mL of the pH substance and 10 mL of hydrogen peroxide because 20 mL of liquid is enough to submerge the potato cube completely in the mixture. We will use graduated cylinders, rather than beakers, to measure because the graduated cylinders will be able to tell us ore accurately where the 10 mL mark is. We will need goggles, because this experiment includes glassware and liquids. We will use plastic rulers because then we will be able to wash off the potato from the ruler.
Materials:
2 graduated cylinders
24 plastic or paper cups
200 mL of vinegar
200 mL of ammonia
200 mL of water
600 mL of H2O2 (Hydrogen Peroxide)
1 knife to cut potatoes
1 ruler (cm)
8 thermometers (Celsius)
Sharpies
Paper Towel
Safety Goggles (one pair per person doing the experiment)
Paper and Pencil (to record data)
Procedure
Safety rules
Please keep goggles on throughout the duration of the experiment, as there is glassware and liquids. Be careful when handling and cleaning the glassware and graduated cylinders. Please be careful with transporting the equipment from the experiment area to the sink. Please do not directly smell any of the substances, particularly ammonia, (that is not pleasant experience.) Rather, if you must know what a substance smells like, you can gently waft the scent towards your nose. After using the knife please place it in an area where it will not interfere with the rest of the experiment or cause any harm, or clean it and return it to its storage area. No horseplay or fooling around with the substances or the knives, because the substances could get into your eyes, and then you will need to use the emergency eye wash kit, and the knife may puncture someone’s skin and cause infection, not to mention bleeding and wounds. Please refrain from drinking the substances. Despite being water and vinegar, this is an experimental setting and thus none of the materials shall enter your mouth. You are not required to wear gloves, however please take caution with the knives when cutting potatoes.
1. Cut one raw potato into 24 cubes, each measuring 1 cm cubed, using a knife.
2. Put one potato cube into each of the plastic cups (one potato per cup; total 24 cups)
3. Use a Sharpie to label 8 cups “Water,” 8 different cups “Vinegar,” and the last 8 cups “Ammonia”
4. Create a data table with 7 columns and 9 rows. Label the second column “Water Initial,” the third column “Water Final,” the fourth “Vinegar Initial,” the fifth “Vinegar Final,” the sixth “Ammonia Initial” and the seventh “Ammonia Final.” Label the rows “Cup 1” “Cup 2”, etc. A copy of the data table format can be found in the Materials section.
5. Use a graduated cylinder to measure and add 10 ml of water to each of the 8 “Water” cups, (each cup should have 10 mL of water)
6. Put one thermometer into each “Water” cup and measure the initial Celsius temperature of each (you may need to wait for the thermometer to stabilize to the temperature of the liquid within the cup.)
7. Record the initial temperature (all temperatures measured and recorded should be in Celsius) of each in the data table’s “Water Initial” column, making sure to keep track of which cup is which. Make sure that the thermometers are still in the cups.
8. Measure 10 mL of hydrogen peroxide in a graduated cylinder. Pour the 10 mL of hydrogen peroxide to one of the 8 “Water” cups. Measure another 10 mL of hydrogen peroxide in the graduated cylinder and pour it into a different “Water” cup. Repeat this until all of the “Water” cups have 10 mL of hydrogen peroxide.
9. After pouring 10 mL hydrogen peroxide into each of the cups, observe the temperatures of each cup’s solution using the thermometer already in the cup.
10. Record the highest temperature shown by the thermometer after adding hydrogen peroxide to the solution in the data table, in the “Water Final” column.
11. Dispose of the solution in the cups, and throw away the used cups and potato cubes. Wash and dry your thermometers and graduated cylinders thoroughly. Wait 2-3 minutes for your thermometers to stabilize to room temperature.
12. Take the 8 “Vinegar” cups and use a graduated cylinder to measure out 10mL of vinegar per cup. Pour 10mL of vinegar into each “Vinegar” cup.
13. Place one thermometer into each “Vinegar” cup and record the initial temperature of each cup in the data table’s “Vinegar Initial” column. Keep the thermometers in the cups.
14. Measure 10 mL of hydrogen peroxide in a graduated cylinder. Pour the 10 mL of hydrogen peroxide to one of the 8 “Vinegar” cups. Repeat this until all of the “Vinegar” cups have 10 mL of hydrogen peroxide.
15. After pouring 10 mL hydrogen peroxide into each of the “Vinegar” cups, observe the temperatures of each “Vinegar” cup’s solution using the thermometer already in the cup.
16. Record the highest temperature shown by the thermometer after adding hydrogen peroxide to the solution in the data table, in the “Vinegar Final” column.
17. Dispose of the solution in the cups, and throw away the used cups and potato cubes. Wash and dry your thermometers and graduated cylinders thoroughly. Wait 2-3 minutes for your thermometers to stabilize to room temperature.
18. Take the 8 “Ammonia” cups and use a graduated cylinder to measure out 10mL of ammonia per cup. Pour 10mL of ammonia into each “Ammonia” cup.
19. Place one thermometer into each “Ammonia” cup and record the initial temperature of each cup in the data table’s “Ammonia Initial” column. Keep the thermometers in the cups.
20. Measure 10 mL of hydrogen peroxide in a graduated cylinder. Pour the 10 mL of hydrogen peroxide to one of the 8 “Ammonia” cups. Repeat this until all of the “Ammonia” cups have 10 mL of hydrogen peroxide.
21. After pouring 10 mL hydrogen peroxide into each of the “Ammonia” cups, observe the temperatures of each “Ammonia” cup’s solution using the thermometer already in the cup.
22. Record the highest temperature shown by the thermometer after adding hydrogen peroxide to the solution in the data table, in the “Ammonia Final” column.
23. Dispose of the solution in the cups, and throw away the used cups and potato cubes. Wash and dry your thermometers and graduated cylinders thoroughly. Wait 2-3 minutes for your thermometers to stabilize to room temperature.
24. Clean up your experiment area, wipe away any spilled substances, throw away the paper towel, wash and dry the knife, rinse and dry the ruler, and place the safety goggles in their designated place.
Change in temperature as a result of ammonia, vinegar, and water
|
|
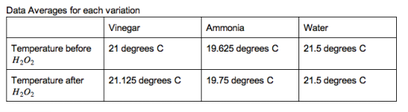
As the data shows, the degree difference between the averages is equal to or less than .125 of a degree. .125 of a degree is not a big enough temperature difference to show catalase activity. Thus we see that pH did not affect catalase activity at all.
Conclusion: Connecting the data to the hypothesis:
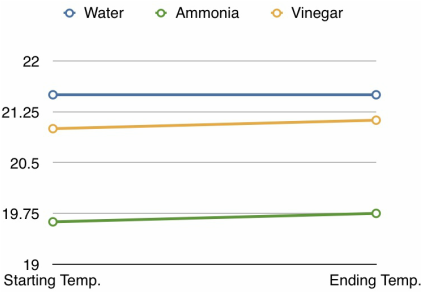
Now, using the data, we can determine whether our hypothesis is supported or not. We do this by looking at the differences between the averages of the initial temperatures and highest temperatures for each variation and seeing if the difference between the averages is a significant difference in temperature. However, we found that in all of the trials, the degree difference did not exceed three degrees, and the averages’ greatest difference was an increase by .125 of a degree, which shows that there was no significant difference between the activity of catalase for all three variations.
The averages’ difference for water was zero degrees, for ammonia was a -0.125 degree difference, and for vinegar was a 0.125 degree difference. While vinegar had the highest increase, these sums are too small to be considered as the effects of the substances on catalase activity. Our hypothesis stated that catalase activity would increase when in an acidic environment, however the data proved this to be false. The data shows that the hypothesis is false because throughout the trials for vinegar, there was no significant increase in temperature from the initial to highest temperature to support higher temperature as a result of increased activity. To summarize, our hypothesis was incorrect because none of our data demonstrated significant enough changes in temperature to show any difference in amounts of catalase activity due to different pHs.
Stating the trend...with data to back it up:
The trend in the data is that there is no correlation between the pH of the environment the catalase is in and the amount of catalase activity. In each trial, the difference between starting and highest temperature was no more than three degrees, and for 18 out of 24 trials, there was no change in temperature. For 4 out of 24 trials, there was a 1 degree difference, and for 2 of 24 trials there was a difference of two or three degrees. For the averages of the variations, the greatest difference was only .125 of a Celsius degree, which cannot be used to show any effect that the pH had on catalase activity, instead these small temperature changes were most likely caused by external temperature influences or was the thermometer simply stabilizing. What should have occurred is (note: this is stated after doing some research) the catalase has the greatest amount of activity in the water trial. This is because the pH of water is closest to that of the pH that catalase usually functions in, which is our body, and in this case, the potato. The potato not only contains a large amount of water, but the pH that the catalase would normally be in is only a little bit higher than seven (water.) It was surprising that not only did the catalase show no activity in the ammonia and vinegar, but that it also had no activity when in water. In the body, what happens is that your body’s slightly base-but-very-close-to-neutral pH is the environment at which the catalase serves its function to break down hydrogen peroxide, so catalase should have had the greatest temperature increase in the water trials. Because enzymes are specific to certain pHs, and catalase is specific to a neutral pH, and too acidic or base pHs would denature the catalase, the catalase should have had the most activity in the water trials, because it is the specific pH that catalase works in, and none of the catalase should denature in the pH that it is specific to.
Error analysis:
Our assumption that ammonia, water, and vinegar could cover the entire pH scale was incorrect. We could have tried ammonia, then ammonia diluted with water, and the same for vinegar. This way we would have been able to test for smaller increments of the pH scale and may have been able to land on the right concentration at which catalase works best. We should have probably put more potato in, because if there was more potato then there would have been more catalase enzymes, which would result in more reaction. Also we know that having a limited amount of enzymes and an abundance of substrates slows activity, so we might have put in too much hydrogen peroxide for the catalase to contend with. We also did not wait for the thermometer to stabilize to the initial temperature. As well as that, we didn’t clean our thermometers very thoroughly, and after subjecting the thermometer to the sink water, we did dry them with a paper towel but we didn’t wait for it to stabilize back to room temperature.
Scope:
Our scope was limited in the aspect that, although we thought that we were testing for how acids and bases affected catalase, we were technically only testing for how the specific pHs of ammonia, vinegar, and water affected catalase activity. Also our scope could have considered factors such as testing body pH to see if that is the best pH for catalase. We might also consider using hydrogen peroxide on its own, without the addition of other substances, to see catalase activity then. We could also have done some research on where catalase is commonly found, and the pHs of those environments, and then used the substances we had at hand to try to reach those pHs.
To fix our errors and limited scope, we could do the following: try smaller increments on the pH scale, by using for a stronger acid pure vinegar, then adding different amounts of water to dilute the vinegar and move up the pH scale gradually, and do the same for ammonia. We could have also cut the potato to maximize contact area between the potato and the substance, so we could cut it into a circle and place it at the bottom of the cup so the surface of the potato could interact more with the substances. We could also have decreased the amount of hydrogen peroxide put in, so that the catalase would be at an optimum activity level without being overloaded with substrates. We could have also watched the thermometers more carefully after we washed them and started using them so that when we measured the initial temperature of the mixture, we got a correct initial temperature instead of the temperature of the sink water. We should have also added a trial as simply hydrogen peroxide with no pH substance added to see how the catalase activity then would be.
Conclusion: Connecting the data to the hypothesis:
Now, using the data, we can determine whether our hypothesis is supported or not. We do this by looking at the differences between the averages of the initial temperatures and highest temperatures for each variation and seeing if the difference between the averages is a significant difference in temperature. However, we found that in all of the trials, the degree difference did not exceed three degrees, and the averages’ greatest difference was an increase by .125 of a degree, which shows that there was no significant difference between the activity of catalase for all three variations.
The averages’ difference for water was zero degrees, for ammonia was a -0.125 degree difference, and for vinegar was a 0.125 degree difference. While vinegar had the highest increase, these sums are too small to be considered as the effects of the substances on catalase activity. Our hypothesis stated that catalase activity would increase when in an acidic environment, however the data proved this to be false. The data shows that the hypothesis is false because throughout the trials for vinegar, there was no significant increase in temperature from the initial to highest temperature to support higher temperature as a result of increased activity. To summarize, our hypothesis was incorrect because none of our data demonstrated significant enough changes in temperature to show any difference in amounts of catalase activity due to different pHs.
Stating the trend...with data to back it up:
The trend in the data is that there is no correlation between the pH of the environment the catalase is in and the amount of catalase activity. In each trial, the difference between starting and highest temperature was no more than three degrees, and for 18 out of 24 trials, there was no change in temperature. For 4 out of 24 trials, there was a 1 degree difference, and for 2 of 24 trials there was a difference of two or three degrees. For the averages of the variations, the greatest difference was only .125 of a Celsius degree, which cannot be used to show any effect that the pH had on catalase activity, instead these small temperature changes were most likely caused by external temperature influences or was the thermometer simply stabilizing. What should have occurred is (note: this is stated after doing some research) the catalase has the greatest amount of activity in the water trial. This is because the pH of water is closest to that of the pH that catalase usually functions in, which is our body, and in this case, the potato. The potato not only contains a large amount of water, but the pH that the catalase would normally be in is only a little bit higher than seven (water.) It was surprising that not only did the catalase show no activity in the ammonia and vinegar, but that it also had no activity when in water. In the body, what happens is that your body’s slightly base-but-very-close-to-neutral pH is the environment at which the catalase serves its function to break down hydrogen peroxide, so catalase should have had the greatest temperature increase in the water trials. Because enzymes are specific to certain pHs, and catalase is specific to a neutral pH, and too acidic or base pHs would denature the catalase, the catalase should have had the most activity in the water trials, because it is the specific pH that catalase works in, and none of the catalase should denature in the pH that it is specific to.
Error analysis:
Our assumption that ammonia, water, and vinegar could cover the entire pH scale was incorrect. We could have tried ammonia, then ammonia diluted with water, and the same for vinegar. This way we would have been able to test for smaller increments of the pH scale and may have been able to land on the right concentration at which catalase works best. We should have probably put more potato in, because if there was more potato then there would have been more catalase enzymes, which would result in more reaction. Also we know that having a limited amount of enzymes and an abundance of substrates slows activity, so we might have put in too much hydrogen peroxide for the catalase to contend with. We also did not wait for the thermometer to stabilize to the initial temperature. As well as that, we didn’t clean our thermometers very thoroughly, and after subjecting the thermometer to the sink water, we did dry them with a paper towel but we didn’t wait for it to stabilize back to room temperature.
Scope:
Our scope was limited in the aspect that, although we thought that we were testing for how acids and bases affected catalase, we were technically only testing for how the specific pHs of ammonia, vinegar, and water affected catalase activity. Also our scope could have considered factors such as testing body pH to see if that is the best pH for catalase. We might also consider using hydrogen peroxide on its own, without the addition of other substances, to see catalase activity then. We could also have done some research on where catalase is commonly found, and the pHs of those environments, and then used the substances we had at hand to try to reach those pHs.
To fix our errors and limited scope, we could do the following: try smaller increments on the pH scale, by using for a stronger acid pure vinegar, then adding different amounts of water to dilute the vinegar and move up the pH scale gradually, and do the same for ammonia. We could have also cut the potato to maximize contact area between the potato and the substance, so we could cut it into a circle and place it at the bottom of the cup so the surface of the potato could interact more with the substances. We could also have decreased the amount of hydrogen peroxide put in, so that the catalase would be at an optimum activity level without being overloaded with substrates. We could have also watched the thermometers more carefully after we washed them and started using them so that when we measured the initial temperature of the mixture, we got a correct initial temperature instead of the temperature of the sink water. We should have also added a trial as simply hydrogen peroxide with no pH substance added to see how the catalase activity then would be.
